The ice world or cryosphere has featured, often, in the press and climate change articles and has often been used to indicate that melting icecaps will bring the end to civilisation as we know it. Now, I am not going to agree or disagree with that statement but I am going to try and put the issues surrounding ice melt/growth into perspective.
I will start with two interesting facts. The first is that approx. 98% of the worlds ice is stored in Antarctica and Greenland. The remaining 2% includes the Arctic and the worlds glaciers. The second fact is that nearly all the ice in the Antarctic and Greenland is ice on land whereas the ice in the Arctic is nearly all ice on water. These two fundamental facts are important, not only for scale, but because ice dynamics are different depending where and how the ice is formed.
ANTARCTIC ICE SHEET

The Antarctic ice sheet is one of the two polar icecaps of the Earth. It covers about 98% of the Antarctic continent and is the largest single mass of ice on Earth. It covers an area of almost 14 million square kilometres (5.4 million square miles) and contains 26.5 million cubic kilometres (6,400,000 cubic miles) of ice. A cubic kilometer of ice weighs approximately one metric gigaton, meaning that the ice sheet weighs 26,500,000 gigatons. Approximately 61 percent of all fresh water on the Earth is held in the Antarctic ice sheet an amount equivalent to about 58 m of sea-level rise. In East Antarctica, the ice sheet rests on a major land mass, while West Antarctica, the bed can extend to more than 2,500 m below sea level.
Satellite measurements by NASA indicate a still increasing sheet thickness above the continent, outweighing the losses at the edge. The reasons for this are not fully understood, but suggestions include the climatic effects on ocean and atmospheric circulation of the ozone hole and/or cooler ocean surface temperatures. For more general information follow the link below.
‘Antarctic Ice Sheet’. In Wikipedia, 1 September 2020. https://en.wikipedia.org/w/index.php?title=Antarctic_ice_sheet&oldid=976199557.
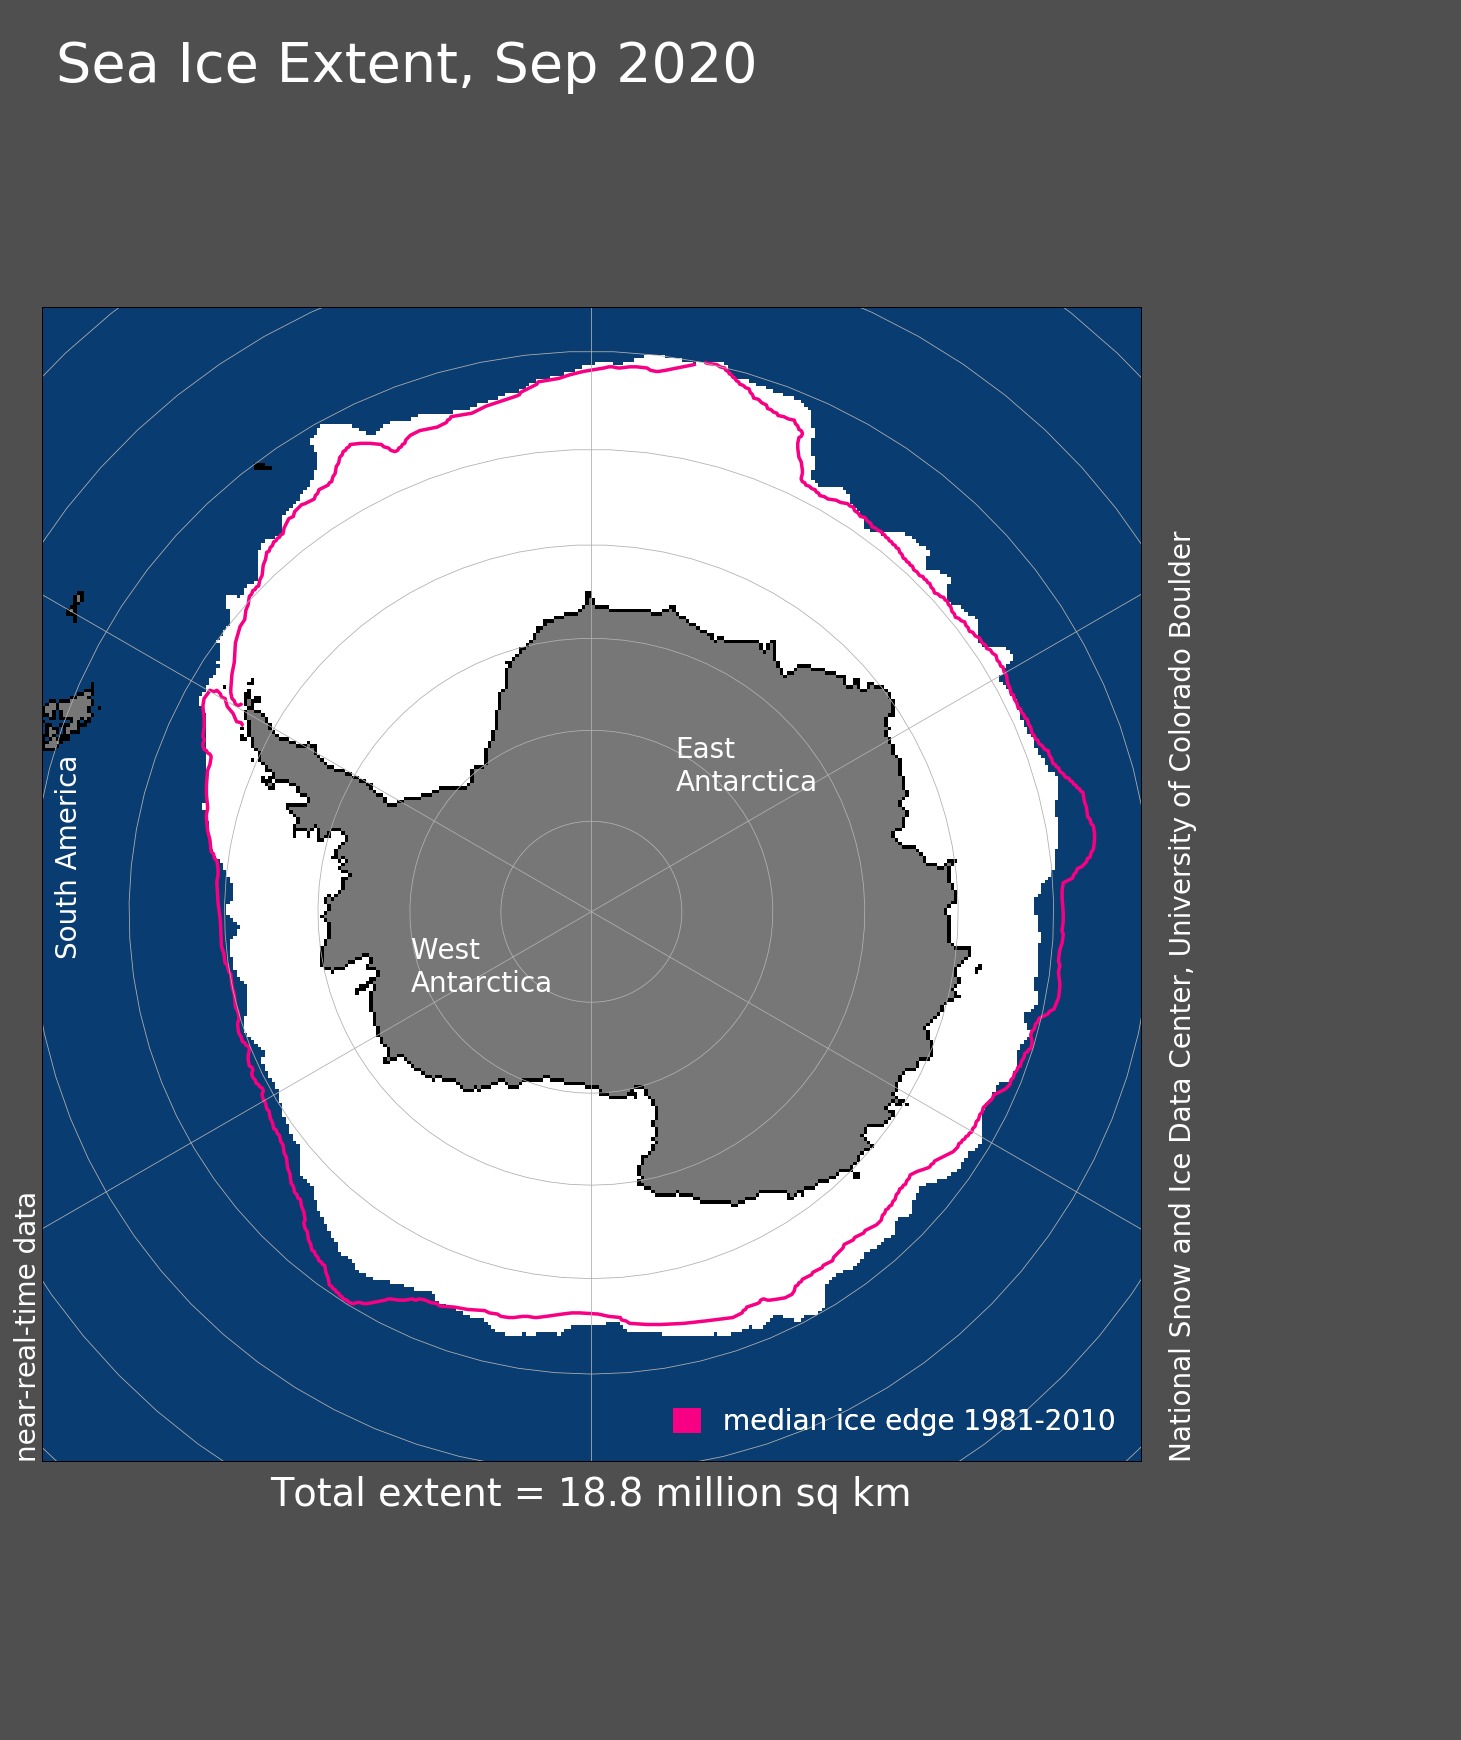
The below picture illustrates the Antarctic sea extent as at the end of september 2020 as published by the National Snow and Ice Data Centre (NSIDC).

Antarctic sea ice extent may have reached its maximum of 18.95 million square kilometers (7.32 million square miles) on September 28th 2020, but the extent could still expand in the coming days. As is typical for this time of year, there are wide swings caused by winds and storms along the extensive ice edge. Ice extent is now well above the 1981 to 2020 median extent. This follows a remarkable transition from generally below median extent beginning in August 2016 to well above median extent just in the seven weeks preceding October 1, 2020. Ice extent is above the median extent along a broad area off the Wilkes Land coast and western Ross Sea, near the median extent from the Amundsen Sea clockwise to the Weddell Sea and above the median north of Dronning Maud Land, Enderby Land, and the Cosmonaut Sea. The only major area of below the median extent is in the Indian Ocean sector near the Amery Ice Shelf and eastward.
So from current data we can say that far from disappearing the Ice mass balance of the Antarctic is increasing.
GREENLAND ICE SHEET
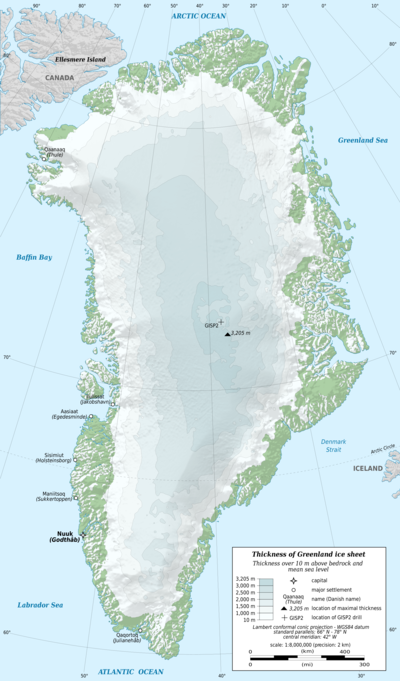
The Greenland ice sheet is a large body of ice that covers approximately 80% of the surface of Greenland. At 1.7 million square kilometers it is the second largest ice body in the world. The Greenland ice sheet is however much smaller than the Antarctic ice sheet. The ice sheet is 2,400 kilometres long. These ice sheets are huge.
In the past the Earth has often had less ice and at times had even more ice. For example, during the Pleistocene Ice Age, almost one third of the Earth’s land was covered by glacial ice. Today, about one tenth of the Earth’s land is covered by glacial ice. Right now, the Antarctic and Greenland ice sheets combined contain more than 99% of the freshwater ice on Earth.
The Greenland ice sheet interacts more intensely with the ocean than the Antarctic ice sheet. The annual snow accumulation rate is more than double that of Antarctica. Glacial melt happens across about half of the Greenland ice sheet, but melting is much more isolated on the far western part of Antarctica. Greenland’s ice shelves break up much faster than those surrounding Antarctica.
However, unlike in 2019, Greenland has actually had a relatively “normal” year with regard to ice changes at its surface. Yet losses via the breaking off of icebergs remain at the high end compared to the early years of the satellite record, which stretches back to the late 1970s.
The ice sheet ends the season losing about 152bn tonnes when accounting for both surface melting and discharge of icebergs. This means that the ice sheet is continuing to lose ice, though at a slower rate than seen in 2019.
The end of August marks the ideal time to assess the health of the Greenland ice sheet.
Typically, this is the point in the year where the ice melt seen through late spring and summer comes to an end and the ice sheet starts to gain mass again as northern hemisphere temperatures decline through autumn and into winter.
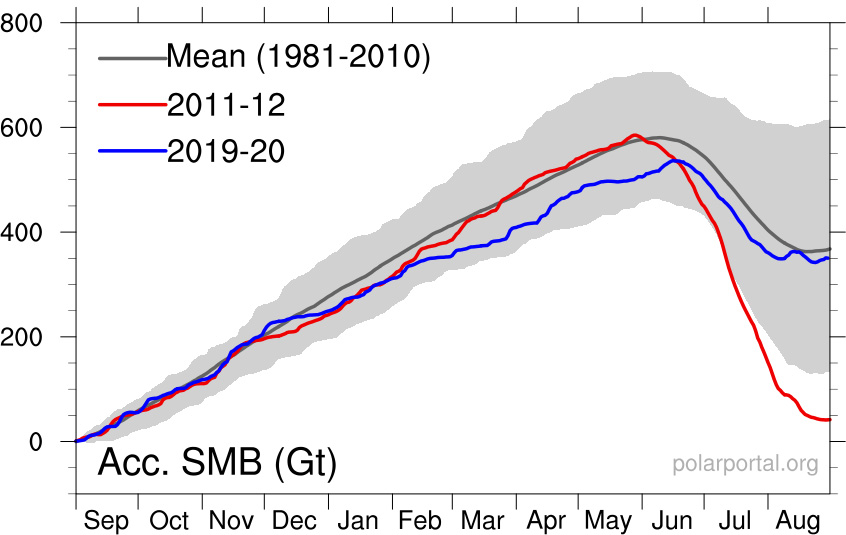
Totting up the snow gains and ice losses at the ice sheet’s surface over the past 12 months gives scientists the “surface mass balance” (SMB). The 2019-20 SMB comes in at a gain of 349bn tonnes of ice.
The chart below shows the cumulative SMB over 2019-20 (blue line), which tracks below the long-term average (grey) for much of the year. The red line shows the record low year of 2011-12 for comparison (Carbonbrief.Org).

I have studied some complicated math concerning the Latent heat of ice and the energy required to melt all the ice in Greenland, and to put it into perspective, if the current rate of ice loss continues, at its current rate, you are looking at approx. 13,000 yrs.
Now, a lot can change in the intermediate period, particularly as some of the other climate variables indicate potential cooling and expansion of the ice sheets. However, I shall discuss this further in the summary to this article.
ARCTIC SEA ICE
The graphic, below, illustrates the sea ice extent of Arctic sea ice as at the 18th October 2020. The visible brown line shows the average sea ice extent for the years 1981-2010.

Credit: National Snow and Ice Data Center
Arctic sea ice extent averaged, for September 2020, 3.92 million square kilometres (1.51 million square miles), the second lowest in the 42-year satellite record, behind only September 2012. This is 350,000 square kilometres (135,000 square miles) above that record low, and 2.49 million square kilometres (961,000 square miles) below the 1981 to 2010 average. Following the minimum seasonal extent, which occurred on September 15, ice growth quickly began along in the northern Beaufort, Chukchi, and East Siberian Seas. Expansion of the ice edge was also notable within the East Greenland Sea and within Canadian Arctic Archipelago. By contrast, the ice edge in the Kara and Barents Seas remained relatively stable until the end of the month when it started to expand, and within the Laptev Sea the ice edge retreated slightly.

Credit: National Snow and Ice Data Center
Now, at present, there is no doubt that Arctic sea ice is diminishing year on year. However, this too could change rapidly if we have a prolonged cooling period. Also, although, dumping large quantities of freshwater into the ocean can have affects on currents etc ( to be discussed in the oceans section) as Arctic sea ice melts. However, it’s melting wont do much to affect sea levels. Think of an ice cube in a glass. As water has the strange habit of expanding when it freezes, when it melts it goes back to its original smaller mass. I hope that makes sense. If your worried about Polar bears a recent survey has been published stating that their numbers have grown by approx. 16%. They will find new habitat and as they are directly descended from Brown bears I don’t think they will have too much of a problem. However, that last statement is only my opinion.
Summary
So how does the cryosphere affect climate. Again I shall keep this simple. Ice and snow reflect energy, from the Sun, back into the atmosphere so helping to regulate Earth’s temperature. Dumping lots of cold, freshwater into the ocean can disrupt the oceans currents. The oceans distribute more heat around our planet than the atmosphere or land.
However, we know from other proxies, such as the Earth’s geology, that the planet we live on has had periods of no ice mass and periods of greater ice mass. Fossil forests have been discovered on Greenland for example. Also, our current land masses are constantly on the move (subject of another article) and sea levels have been both higher and lower than they are now. I think mother Earth will find her own equilibrium balance, of the variables, regardless of what we do as humans.
Copyright M. Taylor 2020
